What Is Fully Diluted Market Cap & What It Means For A Crypto’s Future Value

Before making any investment decision, it is important to understand the current value and success potential of any asset, and this is all the more true in the crypto space where there are no reporting standards. To do this, there are several metrics that investors use, such as market cap and fully diluted market cap.
Although both metrics are similar and commonly used by several crypto investors, they each have different meanings and applications.
What Is Fully Diluted Market Cap?
The fully diluted market cap of a token, which is also known as fully diluted valuation (FDV), is the value of its market cap when all of its tokens have been fully mined or released.
The FDV metric helps investors assess if the current price of the cryptocurrency is sustainable into the future or if it is currently selling above its ideal value.
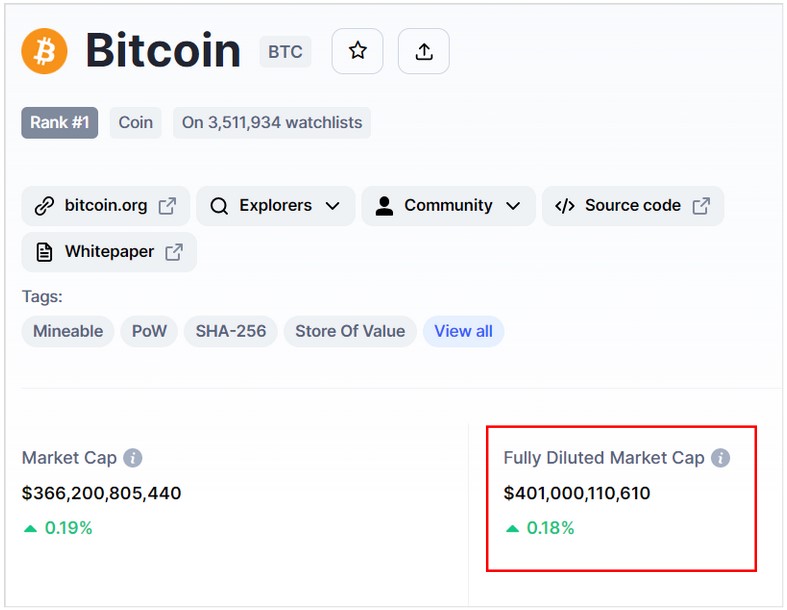
Most crypto data dashboards show FDV (Source: Coinmarketcap)
How to Calculate Fully Diluted Market Cap
To calculate the FDV of a coin, you need to multiply the maximum supply of any given token with the present market price of the token:
Fully diluted market capitalization =
Maximum supply of a coin/token x current token price.
For example, Bitcoin’s maximum supply of coins is 21 million. At its current trading price of $19,099, its fully diluted market cap would be:
21 million x $19,099 = $401,079,000,000
This FDV crypto metric allows investors to understand the future value or market cap of a cryptocurrency if its price were to remain the same into the future until all its coins were sold.
The question you may be asking at this point is: “What is the difference in fully diluted market cap vs market cap?”

Market Cap vs Fully Diluted Market Cap
What Is Market Cap?
Market cap refers to the total value of a cryptocurrency at a specific time period. It is dependent on the current price and circulation of coins at the given time.
Market cap is calculated by multiplying the current price of the coin by the current number of coins in circulation.
Market capitalization=
Circulating coin/token supply x Current coin/token price
Using the example of Bitcoin, its market cap would be:
19,176,843 x $19,099 = $366,258,524,457
As a rule of thumb, the higher the market cap, the more stable the cryptocurrency is perceived to be. The same is true for popularity, as coins that are perceived as stable tend to grow in popularity more often than not.
How is Fully Diluted Market Cap Different from Market Cap?
There are 2 major factors that make FDV different from market cap:
- Accuracy: The market cap gives a fairly accurate idea of the present worth of a coin. The FDV does not give a truly accurate picture of the future worth of the coin; since it can only be projected using current values, it does not take into account the crypto’s future growth and market adoption.
- Inflationary effect: Another drawback of the FDV metric is that it doesn’t factor in the inflationary effects of the coin’s supply on its price. If a coin’s future supply exceeds the market demand for it, its price and value will fall.
This is one of the reasons fully diluted market cap should only be used as a rough estimate of a coin’s future value, and not as a definitive metric.
How to Use Fully Diluted Market Cap in Crypto Trading?
Let’s look at the different possibilities when comparing fully diluted market cap vs market cap and what each of these outcomes mean for investors. Ideally, it is best for the difference between the market cap and the fully diluted market cap to be low.
1) High difference between market cap and fully diluted market cap
If the difference is high, this is a sign that there will be a lot of pressure from inflation as more coins are released, which may indicate that the coin is presently overvalued.
For instance, using an extreme example, if the present market cap of a cryptocurrency is $15 million and its FDV is $200 million, this could be an indication that the coin is currently overvalued.
2) Almost equal difference between market cap and fully diluted market cap
If the difference between the crypto FDV and market cap is barely noticeable, this is often a good sign that the coin is currently fairly valued or undervalued.
For example, if the fully diluted market cap of a cryptocurrency is $10 million and its market cap is also $9.5 million, this would indicate that the coin is currently fairly valued.

Ethereum is currently one of the cryptocurrencies with this kind of FDV (Source: Coinmarketcap)
3) Low difference between market cap and fully diluted market cap
If the difference between the FDV and the market cap is very low, this is an indication that inflation won’t have a huge effect on the value or price, and that the coin is currently undervalued.
A good example of this would be if the crypto FDV was $100 million, and its market cap was $90 million.
This would be an indication that the coin is currently undervalued and that there is potential for growth.

Does Fully Diluted Market Cap Matter?
At this point, if you’re wondering if the fully diluted market cap is a reliable metric, the answer is that it depends.
The fully diluted market cap can give you a good idea of how a cryptocurrency will perform in the future and can be a helpful metric in crypto investment decision-making.
However, it is important to note that the fully diluted market cap is just one metric and should not be used in isolation.
The fully diluted market cap metric can be an especially valuable tool for crypto investors who are looking to invest in a cryptocurrency for the long term. It is always best to analyze fully diluted market cap in combination with other indicators, such as market cap, to get a more accurate picture of a cryptocurrency’s value.
Six Major Indicators Every Beginner Must Know About DeFi
How can beginners understand DeFi protocols through indicators as an investment reference? Remember these six indicators. This article introduces six data indicators that measure the development of a DeFi project: FDV, TVL, DAU, P/S, collateralization ratio, and trading volume.
1. Fully Diluted Market Cap
2. Total Value Locked (TVL)
3. DAU (Daily Active Users)
4. P/S Ratio (Price-to-Sales Ratio)
5. Loan-to-Value Ratio
6. Trading Volume
DeFi, short for Decentralized Finance, has been one of the hottest topics in the cryptocurrency field in recent years since its explosive growth in 2020. As the digital currency market continues to evolve, the DeFi market is also expanding.
The unique financial mechanisms of DeFi have attracted an increasing number of investors to participate, providing crypto investors with more choices and opportunities. However, for newcomers, assessing the investment value and risks of DeFi projects can be quite challenging.
This article introduces six important indicators in the field of DeFi. These indicators will help you gain a better understanding of the actual performance and potential risks of DeFi projects, enabling you to make more informed investment decisions.
1. Fully Diluted Market Cap
In the field of DeFi, the term “fully diluted market cap” refers to the upper limit of the market value of a cryptocurrency asset or protocol. It represents the total market value in the scenario where all the project tokens have been fully issued. Therefore, the fully diluted market cap considers all the tokens that may be issued in the future and can be considered a more comprehensive estimate of the current token value of the project. It is generally used as a reference indicator for the actual value of project tokens.
The formula for calculating the fully diluted market cap is as follows:
Fully Diluted Market Cap = Current circulating token price x Total token supply
Here, “current circulating token price” refers to the price of the tokens currently circulating in the crypto project, and “total token supply” refers to the total number of tokens that can be issued in the crypto project.
For example, let’s assume a crypto protocol currently has 1,000,000 tokens in circulation, with a total supply of 2,000,000 tokens. If the current price of each token is $10, then the fully diluted market cap of the protocol would be:
Fully Diluted Market Cap = $10 x 2,000,000 = $20,000,000
Understanding this metric allows for a horizontal comparison with other projects to estimate the value of tokens in new protocol projects.
It is important to note that the fully diluted market cap is only an estimate of the market value of a cryptocurrency asset or protocol. In reality, due to market fluctuations and the uncertainty of future token issuance, there may be a certain margin of error in the fully diluted market cap.

DeFi Protocol Fully Diluted Market Value Chart. Data source: tokenterminal
2. Total Value Locked (TVL)
In the field of DeFi, TVL refers to the Total Value Locked, which is an indicator used to measure the total value of locked crypto assets in a specific DeFi protocol. It is commonly used to assess the value locked by users in a DeFi protocol, as well as the scale and influence of the protocol.
In fact, the TVL metric is of great importance to DeFi projects, as it can be used to gauge the project’s attractiveness to users and its market performance. Generally speaking, the higher the TVL, the larger the scale of the DeFi protocol, and the more crypto assets are locked in the protocol. On the other hand, it also represents the level of trust users have in it.
However, if two DeFi protocols have the same TVL, we need to compare whether they are incentive-based protocols. Incentive-based protocols often provide certain rewards to users who lock their tokens. Therefore, in the case of the same TVL, non-incentive-based protocols are better able to reflect the trust users have in their protocols.

DeFi Protocol TVL Chart, Data Source: tokenterminal
3. DAU (Daily Active Users)
DAU refers to “Daily Active Users,” which represents the number of independent users who use a specific DeFi protocol or platform on a daily basis. It is one of the indicators used to measure the level of user activity in a DeFi protocol or platform and is also an important metric for assessing the development potential of the protocol or platform. Generally, a higher DAU indicates a larger number of users utilizing the protocol, making it more popular in the market.
As shown in the following chart, among multiple Lending protocols, Aave’s DAU is significantly higher than other Lending protocols, indicating that the Aave protocol is more popular in the market. This can also serve as a reference for us in selecting a protocol.

DAU (Daily Active Users) Chart for Lending Protocol. Data Source: TokenTerminal
4. P/S Ratio (Price-to-Sales Ratio)
If you are a practitioner in the traditional financial industry, you are certainly familiar with the Price-to-Sales ratio (P/S). The P/S ratio reflects the value that people are willing to invest to generate one dollar. In traditional finance, the P/S ratio is often used as a fundamental evaluation criterion to measure market expectations for asset returns and future growth. In the DeFi field, the P/S ratio is an indicator that measures the ratio of protocol market value to revenue (i.e., usage), thereby assessing the reliability of the protocol.
However, it should be noted that the P/S ratio may have different meanings in different protocols. For example, in a decentralized exchange (DEX), the P/S ratio represents the amount the market is willing to pay in dollars for every dollar of transaction fees. In lending protocols, the P/S ratio indicates the amount the market is willing to pay in dollars for every dollar of borrowing interest. Therefore, when comparing DeFi protocols in different categories, the P/S ratio may not be the best comparative indicator. However, when comparing protocols within the same category, it remains a valuable metric.
In DeFi, the P/S ratio can be used to measure the liquidity and market participation of an asset. A higher P/S ratio usually indicates easier buying and selling of the asset due to better liquidity. Additionally, the P/S ratio can be used to identify popular assets or trading pairs in the market.

DeFi Protocol P/S Values. Data source: TokenTerminal
5. Loan-to-Value Ratio
The Loan-to-Value (LTV) ratio refers to the ratio between the value of collateral and the loan amount in a lending protocol. For instance, if you borrow $1,000 in a protocol with a 50% LTV ratio, you would need to provide at least $2,000 worth of collateral. A higher LTV ratio indicates stricter risk management by the protocol and also means that you would need to provide more collateral to obtain the same loan amount.
Understanding the importance of the LTV ratio helps you better evaluate the risk and return of a lending protocol. If a protocol has a low LTV ratio, it suggests potential risks because a decline in the value of the collateral may lead to loan defaults and collateral liquidation. Therefore, protocols with higher LTV ratios are generally considered safer and more reliable. (The LTV ratio is typically visible on relevant decentralized exchanges or lending platform interfaces.)
6. Trading Volume
In the DeFi field, trading volume refers to the total volume of all transactions conducted on decentralized exchanges (DEXs). A higher trading volume indicates a more active DEX and can also serve as an important indicator for evaluating the activity of the DeFi market. The higher the market activity, the higher the trading volume of the entire DeFi market.

DeFi Trading Volume Chart, Data Source: TokenTerminal
These are the six key metrics we have shared, which investors can refer to when making investment judgments on DeFi projects. However, it should be noted that investment in the DeFi market should not solely rely on these metrics. Investment decisions in DeFi require more comprehensive and detailed analysis. Investors also need to pay attention to factors such as the project’s technical capabilities, team background, and governance mechanisms, as well as market risks and potential risks. Only by fully understanding all aspects of a project can wise investment decisions be made.
Author: Keven
Translator: Piper
Reviewer(s): Hugo、Edward、Hin、Ashley He
* The information is not intended to be and does not constitute financial advice or any other recommendation of any sort offered or endorsed by Gate.io.
* This article may not be reproduced, transmitted or copied without referencing Gate.io. Contravention is an infringement of Copyright Act and may be subject to legal action.
Related articles

What is Stablecoin?
A stablecoin is a cryptocurrency with a stable price, which is often pegged to a legal tender in the real world. Take USDT, currently the most commonly used stablecoin, for example, USDT is pegged to the US dollar, with 1 USDT = 1 USD.
Dec 16, 2022

What is Liquidity Farming?
Liquidity Farming is a new trend in Decentralized Finance (DeFi), which enables crypto investors to fully utilize their crypto assets and obtain high returns.
Dec 24, 2022

What Is DeFi?
DeFi is a financial system open to global users, including lending, trading, minting, insurance and other services.
Nov 21, 2022
- About Us
- Careers
- User Agreement
- Privacy Policy
- Fee
- Media Kit
- 100% Collateral
- Gate SAFU
- Gate Labs
- Gate Ventures
- Gate Grants
- Security
- Announcement
- Community
- GT user privileges
- Gatechain
- Calendar
- Legal Compliance & Regulation
- Cryptocurrency Prices
- ETH 2.0 Upgrade
- P2P Trading
- Trade
- Perpetural Futures
- Leverged tokens
- Startup
- Finance
- NFT
- Crosschain
- Gate Pay
- MiniApp
- Gift Card
- ETH 2.0
- About USDG
- Gate OTC
- Gate Charity
- Gate Card
- Big Data
- User Feedback
- Help Center
- Submit a request
- Listing
- Smart Contract Security
- Developers (API)
- Verification Search
- P2P Merchant Application
- P2P Blue V Application
- Institutional and VIP Services
- Broker Program
- Influencer Program
- Referral Program
- Affiliate Program
- Moments
- Post
- Live Stream
- Chatroom
- News
- Future Events
- Blog
- Gate Learn
- Cryptopedia
- Explore Hot Topics
- Bitcoin Halving
- How to Buy GT
- How to Buy Bitcoin
- How to Buy Ethereum
- How to Buy USDT
- How to Buy DOGE
- How to Buy Crypto
- Crypto Price Prediction
- Lend & Earn
- Gate Wealth
- Auto-Investment
- ETH2.0 Staking
- HODL & Earn
- Structured Products
- Dual Investment
- Crypto Loan
- Liquidity Mining
- Cloud Mining
- Slot Auctions
- 简体中文
- English
- Tiếng Việt
- 繁體中文
- Español
- Русский язык
- Français
- Deutsch
- Português (Portugal)
- ภาษาไทย
- Indonesia
- Türkçe
- 日本語
- عربي
- Українська
- Português (Brasil)
What is Crypto Market Cap and How To Calculate It?

If you’ve ever invested in stocks or mutual funds, you’ll know the importance of the term market capitalization. Market capitalization (or market cap) refers to the total value of all a company’s shares of stock. It is calculated by multiplying the price of a stock by its total number of outstanding shares. For example, a company with 20 million shares selling at $50 a share would have a market cap of $1 billion.
This concept also applies to the crypto space because knowing the market cap of individual assets and the crypto sector as a whole can be an important factor towards better understanding the direction of the market.
Why should you care about Market Capitalization?
Market cap measures what a company is worth on the open market and the market’s perception of its future prospects. Thus, market capitalization is a simple, yet effective measure of how valuable a particular company or an industry is. It maps the current growth trajectory of a company and also helps predict its future course. As a whole, market cap is a measurement that can help people make wise investment decisions.
In crypto, market cap is used to understand the value of an asset and its growth from a broader perspective. However, this is separate from the “total crypto market cap,” which can help shed light on where crypto stands in comparison to other sectors of the economy.
How to calculate market cap of a Crypto Asset?
For individual cryptocurrencies, the market cap is the total value of all the coins or tokens that have been mined. It is relatively simple to calculate this number, which is derived by multiplying the price of a single coin with its total circulating supply. Let’s calculate the market cap of Bitcoin (BTC) to better understand this concept.
| Market Cap = the price of individual coin x total circulating supply |
As of April 2021, the price of an individual Bitcoin is $55,165. The total circulating supply is 18,686,162 BTC. In order to get the market cap of Bitcoin, we need to multiply these two values.
Thus, Bitcoin’s Market Cap = $55,165 x 18,686,162 = $1,030,837,521,611. Therefore, the total market cap of Bitcoin is $1.03T. We can apply the same concept to the other crypto assets as well.
How to calculate a Fully Diluted Market Cap
Diluted market cap is a measure that gives us an idea about the future growth of the network, and is calculated by multiplying the current value of an individual coin with the total intended supply.
current price of an individual coin x total intended supply
For example, Bitcoin has a max supply of 21 million, but there are currently 18.6 million BTC in circulation. This means in the future, all 21 million coins will eventually be in circulation. So when we multiply this with the current price of 1 BTC, we get a Bitcoin Fully Diluted Market Cap = $55,165 x 21,000,000 = $1,158,476,473,502. Thus, the fully diluted market cap is approximately $1.1T.
Crypto Asset Classification By Market Cap
Based on their market cap, crypto assets are classified into three major categories.
- Large-cap cryptocurrencies: Cryptocurrencies that have a market cap greater than $10B are considered to be large-cap cryptocurrencies. Coins like Bitcoin (BTC) and Ether (ETH) make this list. Large-cap cryptocurrencies have seen substantial growth over the years and are considered to be low-risk investment options.
- Mid-cap cryptocurrencies: Cryptocurrencies that have a market cap between $1B and $10B are considered to be mid-cap cryptocurrencies. These cryptocurrencies have the potential to see enormous growth in the future.
- Small-cap cryptocurrencies: Cryptocurrencies that have a market cap of less than $1B are considered to be small-cap. They are considered to be risky investment options but could also see enormous gains.
What is The Total Crypto Market Capitalization?
The total crypto market cap is a measure that depicts the value of the entire crypto industry. The value is derived by adding together the market cap of all cryptocurrencies, including Bitcoin, altcoins, stablecoins, and tokens. This is a very important metric as it shows the potential growth of the entire crypto industry. However, because cryptocurrencies are highly volatile the total crypto market cap can change drastically from time to time.
In April 2021, this value surpassed $2T, marking an important milestone in the history of crypto. However, with a market cap of $1.03T, Bitcoin occupies more than 50% of the entire crypto market cap. This is called “Bitcoin Dominance.”
Apart from this, the five other major coins, Ether (ETH), Polkadot (DOT), Tether (USDT), and Cardano (ADA) account for $422B or up to 20.5% of the total value. The remaining 28% of the market is occupied by other smaller coins.
Final Thoughts
While there are some investors who swear by a market cap, there are still some who believe that market cap does not provide an exact estimate of a crypto asset’s value. Nevertheless, it is an important metric to analyze while keeping a close eye on other metrics as well.
Полностью разводненная стоимость (FDV)
FDV — это общая стоимость или рыночная капитализация криптовалюты, если бы все токены находились в обращении.
Что такое полностью разводненная стоимость (FDV)?
Сегодня при инвестировании в компанию или криптовалютный проект инвесторы уделяют большое внимание полностью разводненной стоимости (англ. fully diluted value). Это одна из важных метрик для понимания токеномики проекта.
Чтобы определить полностью разводненную стоимость криптовалюты, нужно взять общее предложение, а затем умножить это число на цену монеты. Чтобы узнать показатели для конкретной представляющей интерес криптовалюты, порой приходится провести небольшое расследование.
Различие рыночной капитализации и полностью разводненной стоимости
К примеру, если оборотное предложение криптовалюты ABC составляет 10 000 токенов, а стоимость каждого токена будет $1, то рыночная капитализация этой криптовалюты равна $10 000.
Однако в будущем может появиться больше токенов. Например, монеты или токены удерживаются от публичной продажи их создателями для последующего выпуска с целью финансирования развития или маркетинговых инициатив. В этих случаях может быть полезно подумать о том, что произойдет, если все эти монеты будут выпущены в обращение одновременно по текущей рыночной цене. Это дает представление о том, какой тогда будет цена за акцию или токен, купленные сегодня, когда всё остальное остаётся неизменным.
Каждый криптовалютный проект на начальных этапах объявляет о максимальном предложении и сроках его достижения.
Если максимальное предложение криптовалюты ABC заявлено в 1 миллион токенов, то её FDV составит 1 миллион долларов.
Концепция FDV может быть применена и к традиционному трейдингу или фондовым рынкам.
Полностью разводненная стоимость компании — это сумма, которую вы заплатил бы, если бы купил все находящиеся в обращении акции, плюс все акции, которые потенциально могут быть выпущены, такие как опционы и конвертируемый долг. Инвесторам критически важно знать полностью разводненную стоимость, потому что она позволяет увидеть более полную картину будущего компании. Это в свою очередь помогает оценить потенциал инвестиции.
Опционы и конвертируемый долг — это два источника акций, которые влияют на полностью разводненную стоимость. Опционы — это контракты, которые дают держателю право на покупку акций по установленной цене в будущем. Если вы учтете все опционы как текущие акции, то получите полностью разводненную стоимость компании. Конвертируемый долг — это тип займа, который позволяет держателям долга конвертировать свои займы в акции компании по установленной цене.
Если вы рассчитаете полностью разводненную стоимость без учета этих двух элементов, можно недооценить стоимость инвестиций и принять не лучшее инвестиционные решения. Например, если первоначальная оценка стоимости компании составляла 100 миллионов долларов, но у неё были непогашенные опционы на 50 миллионов долларов и конвертируемый долг на 30 миллионов долларов, то фактическая стоимость составит 180 миллионов долларов — на 80% больше, чем первоначальная оценка.
Можно ли считать FDV сильной метрикой, которую необходимо принимать во внимание, все еще остается предметом дебатов. Некоторые инвесторы считают её мощным инструментом, в то время как другие настаивают, что эта концепция вводит в заблуждение, когда дело касается криптовалютных инвестиций.